
Ice Hockey Over/Under Betting and Goal Totals Analysis
 Available in US
Save Percentage Trends Impacting Ice Hockey Totals Betting
NHL save percentage in 2024-25 dropped to .901 — the lowest league-wide save percentage in nineteen seasons. The peak, back in 2014-15, was .915. Fourteen points of save percentage across a decade doesn’t sound like much on paper. It’s actually enormous. A goalie facing thirty shots a game with a .901 save percentage concedes nearly three goals on average. The same goalie at .915 concedes 2.55. Multiply that by sixty-plus games per club per season and you’ve got the arithmetic foundation of a totals market that doesn’t behave the way it used to. When wagering on game totals, you must account for the NHL empty-net and late-game betting dynamics that frequently push the score over the line.
I started taking the falling save percentage trend seriously around the 2022-23 season. By 2024-25 the data wasn’t subtle. Game totals were drifting up across the board, the over was hitting more reliably on listed totals of 6 and 6.5, and the books were noticeably slower to push lines past 6.5 even when the matchup data supported it. That gap — where the on-ice scoring environment had genuinely shifted but the books still defaulted to a 6.0 or 6.5 hang point — is where most of my totals profit came from in the last two seasons. Andrei Vasilevskiy gave one of the better practitioner explanations of why this is happening: I feel that players don’t waste shots anymore. When I came into the league in 2014-15, it used to be 30 or 35 plus shots every game. It was almost every night you felt good about your performance because you were in the game all the time. Today, players don’t waste shots. It’s about quality.
Quality over volume means more goals, more efficient power plays, and more pressure on the goalie regardless of save percentage.
This guide unpacks how to bet hockey totals in the current environment — game totals, team totals, period totals, alternates — and how to incorporate the save-percentage trend without overrotating into permanent over-betting.
How hockey totals actually work
The total in hockey is the over/under on combined goals scored by both teams. Standard totals are listed in half-goal increments — 5.5, 6, 6.5, 7 — with the most common hang points being 6 and 6.5. The total includes regulation, overtime, and any shootout goal that decides the game. The shootout adds exactly one goal to the final score regardless of how many rounds it takes, which is a quirky bit of arithmetic that affects totals betting in tied games.
Pushes happen at integer totals (5, 6, 7) when the final combined score matches exactly. At a half-goal total like 6.5, there’s no push possibility — every result settles. The market price changes slightly between half-goal and integer totals to reflect that. A total of 6 might be priced at -110/-110 with the possibility of a push at exactly six goals scored. A total of 6.5 might be priced at -105/-115 with no push possible. The juice asymmetry compensates for the push probability.
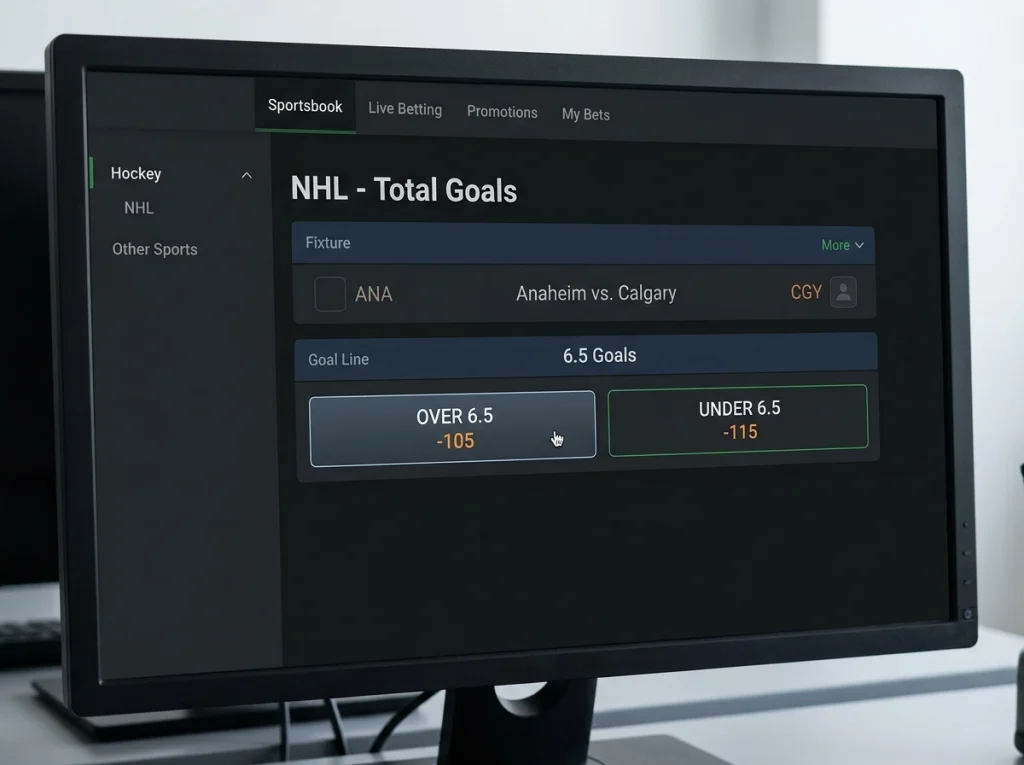
Alternate totals exist on most UK books — 5, 5.5, 7, 7.5, 8 — at adjusted prices. The over 7.5 might be priced at +175 to +200 on a typical NHL game, while the under 5.5 might be priced similarly on the other side. These aren’t standard plays; they’re tools for when you have a strong opinion on game pace or defensive structure that doesn’t fit a half-goal swing.
The single mechanical detail UK punters most often misunderstand: the total includes overtime and shootout goals. A game tied 3-3 after sixty minutes that goes to overtime and is won 4-3 settles as a 7-goal total. A game tied 2-2 that goes to a shootout is officially logged as 3-2 — one shootout-decider counts — for a 5-goal total. Always check whether the listed total includes OT/SO at your book; almost all UK books include them, but the rare exception of “regulation total” markets does exist.
The save percentage trend and what it means for totals pricing
The save percentage drop from .915 to .901 across a decade is the structural story of NHL totals betting in this era. It isn’t a one-season blip. The decline has been gradual and consistent, driven by a combination of higher shot quality, more efficient power-play units, better-coached offensive structures, and goalies who haven’t kept up with the offensive innovation.
The practical implication is that historical totals data from the 2010s is no longer the right reference point. A game total of 6 in 2014 was a reasonable line; the same matchup in 2025 might genuinely be priced closer to 6.5 or even 6.75. The books have shifted, but my own data shows they shift more slowly than the underlying environment. The over at 6 on a game between two top-six offences with average starters has historically beaten the under across the last two seasons, because the books still default to a base total that reflects a slightly older scoring environment.
That doesn’t translate to blanket over-betting. The save-percentage decline affects games unevenly. A matchup between two clubs with elite starters and structured defensive systems can still settle in the 4-5 range. A matchup between two clubs with shaky backups and porous defensive structures can blow past 7. The trend lifts the average but increases the dispersion. Reading individual matchups against the average is where the work is.
One filter I use heavily: when both starters in a game have save percentages above .920 over their last ten starts, the under at 6 or 6.5 is genuinely attractive. The starters are above the league average by a meaningful margin, and the matchup has structural reasons to settle low. When at least one starter has a save percentage below .895 over his last ten, the over at 6 or 6.5 is the favoured side. The ten-start window is the right one — it captures recent form without being too noisy.
The save-percentage trend will eventually reverse. Goalie development cycles, equipment changes, rule tweaks — something will pull the average back up. Stay alert to that. The day the trend reverses meaningfully is the day the over edge disappears and the under edge starts to appear. Track the league-wide save percentage every month; it’s a leading indicator for which side of the totals market is mispriced.
Team totals — the market most UK punters never use
Team totals are exactly what they sound like: the over/under on goals scored by one specific team. Edmonton Oilers team total over 3.5 means Edmonton must score four or more goals for the over to settle. The other team’s score is irrelevant.
This is one of the more interesting markets in hockey betting and one of the least-bet by UK punters. The reason it matters is precision. A game total tells you nothing about which team is supposed to do the scoring. A team total isolates exactly the opinion you might have — that one club specifically will go off offensively against a vulnerable goalie. The pricing tends to be looser than game totals because the volume on team totals is thinner, and the book’s model has less data to calibrate against.

The team total I bet most often is the elite-offence-against-weak-backup spot. When a top-five offensive club (Edmonton, Colorado, Tampa Bay in recent seasons, Florida) faces a club starting a backup goalie with a sub-.890 save percentage, the team total over 3.5 or even 4.5 becomes attractive at the right price. The matchup is structurally lopsided in a way that game totals don’t fully isolate, because the game total reflects the expectation that the other side will score too. If the opposing offence is also middling, the game total stays around 6 — but the team total on the elite side specifically can be a 5-goal night.
The reverse spot also works. Team total unders on clubs with weak offensive structure against elite starters can find value at 2.5. The Dallas Stars at home with an 88.4% penalty kill — the league’s best in 2024-25 — present a genuine team-total-under spot when the visiting club has a power play below 20%. The defensive structure denies the most efficient scoring chances, the penalty kill takes away the power-play goals, and the visiting team’s total comes in under 2.5 more often than the market prices.
The other underused team-total angle is the home team’s individual total in a back-to-back spot where they’re on the second night. The home club is tired, the road club is rested, and the home team’s offensive output drops more sharply than the game total adjusts for. The team total under on the tired home side has been a consistent angle across multi-season samples.
Period totals and the third-period push
Period totals are over/under markets on goals scored in a specific period. UK books typically offer first-period, second-period, and third-period totals separately, plus occasionally 1st-and-2nd-period combined.
The most useful period market is the first-period under. First periods in the NHL skew structurally low-scoring — typical first-period totals are 1.5, occasionally 2 for high-scoring matchups. Teams come out cautious, the pace builds across the game, and the average goals in the first period sits well below the per-period average across all three. First-period under 1.5 hits more often than not in matchups between defensive clubs and especially in division games. The price is usually -130 to -150 — heavy juice, but the hit rate justifies it in selective spots.

Second-period totals are the trickiest. The middle period in hockey is structurally higher-scoring than the first because line changes are longer (the bench is on the opposite side from the team, making changes slower and creating more zone-time imbalances). Second-period over 1.5 hits often, but the books price this in.
The third-period push is the period market with the most repeatable structural edge. Late-game scoring patterns in hockey are heavily influenced by score state — a tied game in the third stays tight, while a one-goal game produces empty-net pushes that inflate third-period totals. The third-period total over 2 in a one-goal game heading into the period is genuinely positive-EV across multi-season samples, because the empty-net goal that decides puck-line bets also frequently pushes the period total over.
Period totals are also the market where UK books are most likely to have stale lines mid-game. The live market for period totals during the second-period intermission is often slow to update, and a sharp punter who catches a line that hasn’t reflected the score state of the game can find genuine value. I don’t bet period totals as a primary strategy, but I check them during intermissions on most slates I’m watching.
Alternate totals and the juice trade-offs
Alternate totals — 5, 5.5, 7, 7.5, 8 — give you the option of trading off probability for price. The standard 6.5 total at -110 implies roughly a 52% hit rate to break even. The alternate over 7.5 at +200 implies a 33% hit rate to break even. Whether the alternate is the better bet depends on whether you think the true probability of the over is closer to 33% or closer to 52% — and how confident you are in that estimate.

The most useful alternate I bet is the over 7.5 in matchups where I genuinely think the game settles at 8 or more. Two top-six offences, two backup goalies, both clubs running fast-pace systems. At +200 on the over 7.5, I need to be right about a third of the time to break even. In the spots I’ve described, the hit rate is closer to 40%, which produces meaningful ROI. The variance is high — I’ll lose three or four in a row regularly — but the EV justifies the swings.
The under 5.5 alternate is the inverse spot. Two elite starters, two clubs with strong defensive systems, division game, both clubs on their first day of rest. The price is typically +150 to +200 on the under 5.5. The hit rate in those filtered spots runs around 35% to 40%, again producing positive EV.
Alternate totals at the extremes — over 8.5, under 4.5 — exist on some books but the prices are too long to be useful except in genuinely lopsided matchup conditions. I bet these maybe once or twice a season. They’re not a regular tool.
Pace, style, and back-to-back fatigue
The fundamental question for any totals bet is whether the game’s underlying conditions support the listed total. Pace is the cleanest single variable. Some clubs play structured, low-event hockey that produces fewer shots and fewer high-danger chances. Other clubs play loose, transition-heavy hockey that produces more chances on both sides. The matchup of two transition clubs is structurally over-friendly. The matchup of two structured clubs is structurally under-friendly.

I track pace with a simple metric: average shots per game by team, both for and against, over the last fifteen matches. Clubs running over 32 shots-for and 32 shots-against per game are the high-pace clubs. Clubs running under 28 of either are structured clubs. The matchups between these tiers tell you what to expect — and the listed total doesn’t always reflect them cleanly.
Back-to-back fatigue affects totals differently than it affects moneylines. The tired team scores less but also defends less efficiently. The net effect on game totals is usually slightly under-friendly — fatigue produces sloppier hockey but also slower hockey, with less transition speed and fewer odd-man rushes. The under in back-to-back-tail games is a small edge across long samples, not a huge one. Where it gets bigger is in pace clubs specifically: a pace club on the second night of a back-to-back can’t sustain their normal style, and the under becomes more interesting than the listed total suggests. We have more detail on how to apply these scheduling angles in the NHL power play betting trends piece, since special teams and pace interact heavily on totals.
One more variable that’s underrated: which arena. Some NHL arenas have historically produced higher-scoring games than others — Madison Square Garden, Bell Centre, T-Mobile Arena have all run high-scoring across multi-season samples. The reasons aren’t always clear, but the data is consistent enough to factor in. A handful of arenas systematically run low-scoring — usually arenas housing structured defensive clubs that have played in the same building for years. Knowing which arenas skew which way is the kind of detail that separates handicappers who watch the game from handicappers who just read the lines. Discover more profitable angles and exclusive insights at Slapline to stay consistently ahead of the bookmakers.
Why are NHL totals trending higher in 2024-25 than the previous decade?
The league-wide save percentage dropped to .901 in 2024-25, the lowest in nineteen seasons. That single number tells you the scoring environment has shifted. Higher shot quality, more efficient power plays, better offensive coaching structures, and goalies who haven"t kept up with the innovation have combined to produce more goals per game than in the early 2010s. The trend has been gradual but consistent, and the books have shifted their default totals upward more slowly than the on-ice reality.
Does the OU total include overtime and shootout goals?
Yes, at almost every UK book. The total includes regulation, overtime, and any shootout-deciding goal. A 3-3 game decided 4-3 in OT settles as a 7-goal total. A 2-2 game decided in a shootout settles as a 5-goal total because the shootout adds exactly one goal regardless of how many rounds it takes. There are rare "regulation total" markets at some books, but those are the exception — always check the market label before betting.
How do I value a team total against the game total?
The game total tells you the expected combined goals for both clubs; the team total isolates one side. If you think the matchup is lopsided — one club"s offence against a weak opposing goalie — the team total on the strong side can be the better expression of the opinion than the game total. The trade-off is that team totals carry slightly more juice and have less liquid markets at most UK books. Use team totals when your opinion is one-sided; use game totals when both clubs play similar style.
What is the third-period push effect on hockey totals?
Late in close games, the trailing club pulls their goalie for the final two minutes to add an attacker. The leading club often scores into the empty net, which adds a goal that wouldn"t otherwise have come. That late goal pushes period totals over and can also push game totals over a half-goal line. In matchups where the game heads into the third tied or with a one-goal margin, the third-period over has been a consistent edge across multi-season samples.
Articles
Created by the "Ice Hockey Betting Tips" editorial team.
