
Match Winner Markets and Ice Hockey Moneyline Bets
 Available in US
Pricing Discrepancies in Ice Hockey Moneyline Markets
Home teams in the NHL won 56.6% of their games outright in 2024-25. Read that number twice. More than half of all games go to the home side — and yet I’ve watched UK punters spend whole seasons fading home favourites because “they’re priced too short”. That logic only works if the home favourite price is genuinely shorter than the implied win probability the data supports. Most of the time it isn’t. Most of the time the market has the favourite priced about right and the punter has talked themselves out of the obvious bet. If the standard odds lack value, exploring NHL 3-way regulation betting can offer significantly better payouts for predicting a clear 60-minute winner.
This is a moneyline guide for UK punters, which means it needs to do three things US-focused guides usually don’t: translate fractional and decimal odds into implied probability without making your head hurt, explain why the 2-way and 3-way moneylines in hockey behave differently, and walk through where the moneyline is actually the right bet versus when you should be on a different market entirely. Nine years of pricing this stuff has taught me that the moneyline is the most honest market in hockey — it tells you exactly what the book thinks the win probability is — and the most informative starting point for any other bet you’re considering.
2-way versus 3-way moneylines, and why hockey has both
Hockey is one of the few major sports where two different moneyline markets exist on the same game, and the difference matters enormously for UK punters. The 2-way moneyline includes overtime and the shootout — whichever team wins, by any path, wins the bet. The 3-way moneyline, sometimes labelled “regulation time” or “60 minutes”, only considers the score after sixty minutes of play. A tie at the end of regulation settles the 3-way moneyline as a “draw” outcome, regardless of what happens in OT.
Most UK books default to displaying the 2-way market because the public finds it easier to understand. The 3-way market is usually one tab over, sometimes labelled “regulation result” or “1X2” in football-style nomenclature. Switch to the 3-way display and you’ll see three prices: home team in regulation, road team in regulation, and the tie. The prices are longer because each outcome carries lower probability than its 2-way equivalent.
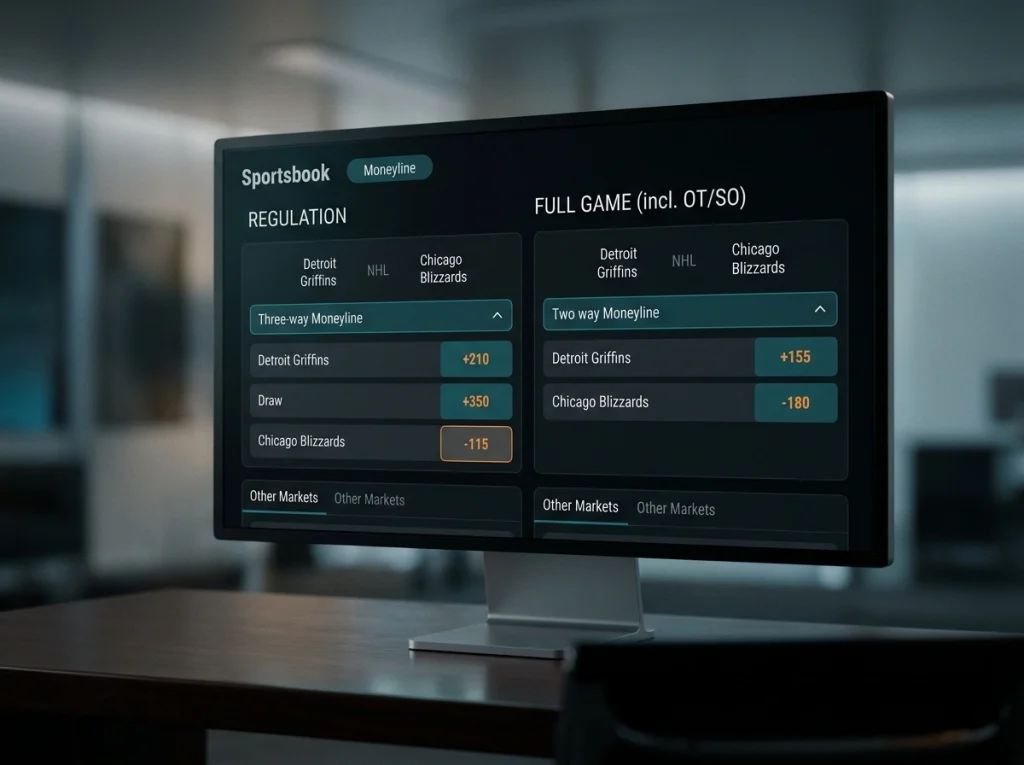
Here’s why this matters for betting decisions. In recent NHL seasons, roughly 23% to 25% of games have gone past regulation. That means about a quarter of the time, the 3-way moneyline pays nothing on either side and instead pays the tie. If you’re confident about which team is better but uncertain about whether the gap is enough to settle in sixty minutes, the 2-way moneyline is the appropriate market. If you have a strong opinion about a club’s third-period dominance and their tendency to win games outright in regulation rather than playing for a tie, the 3-way regulation line can pay materially better.
The pricing differential is real. A team priced at -150 on the 2-way moneyline is often around +110 to +120 on the 3-way regulation line — plus-money on the same opinion you’d be paying juice for on the 2-way. The cost is the overtime variance. Pick your spots. Heavy favourites in divisional games where both clubs play structured systems and overtime is more likely tend to make the 3-way regulation line worse value. Heavy favourites against clubs that play loose, run-and-gun hockey tend to settle in regulation more often and make the 3-way the better bet.
I bet the 3-way regulation moneyline maybe 15% of the time I bet a hockey moneyline. It’s not my default. But knowing the option exists, and knowing when it’s the better-priced version of the same opinion, is the kind of detail that separates UK punters who think they’re betting moneylines from UK punters who actually understand what they’re betting.
Reading the moneyline in three formats
UK punters live in a frustrating dual-format world. Most domestic books display fractional odds by default, decimal odds as a toggle, and almost never American odds. The hockey betting world online — Twitter, blogs, US-oriented content — uses American odds almost exclusively. Working across all three formats fluently is a UK punter’s basic literacy requirement.
Decimal odds are the cleanest mental model. A decimal price of 2.10 means your total return per pound staked is £2.10, including the stake. The implied probability is simply 1 divided by the decimal odds: 1 / 2.10 = 47.6%. That’s the number you actually want to know — what does the market think the win probability is, before vig — and decimal odds make it trivial to derive.
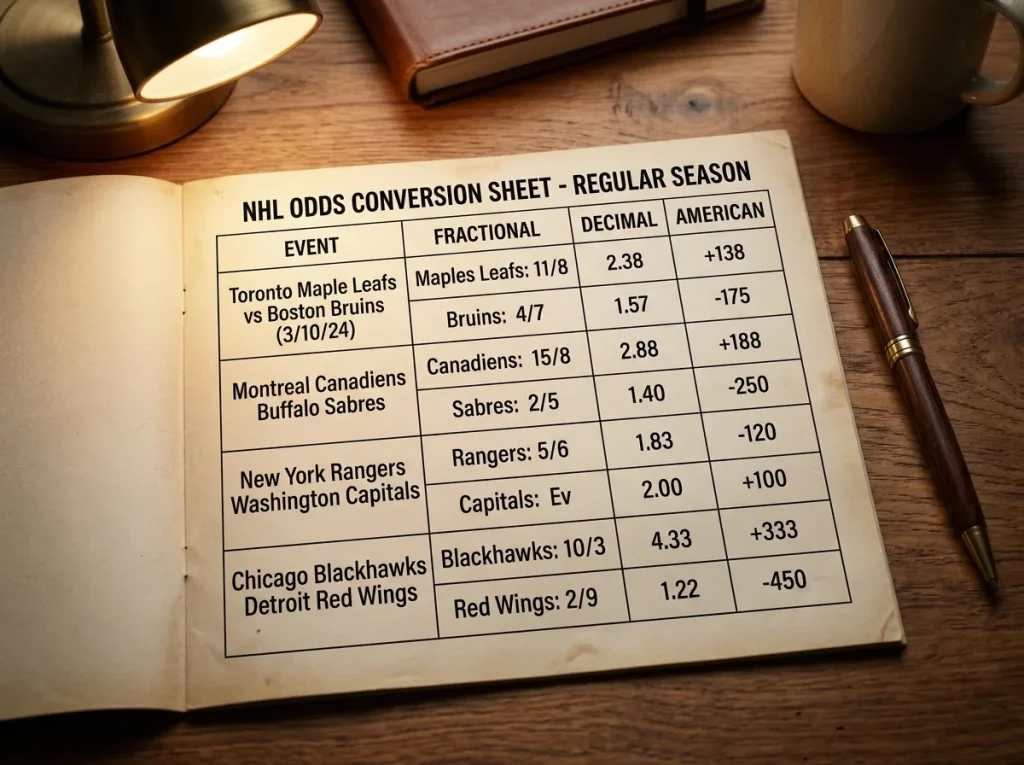
Fractional odds are the British default but they bury the implied probability behind a fraction. 11/10 means you win £11 for every £10 staked, plus your stake back. The total return is £21 on £10, or 2.10 decimal. The implied probability is 10 / (11 + 10) = 47.6%. Same number, more steps. The mental conversion to implied probability is what slows down decision-making in a busy slate, which is why I switched my UK accounts to decimal display years ago and never looked back.
American odds — used by all US books and most analytical content — are negative for favourites and positive for underdogs. A -150 favourite means risking £150 to win £100. A +130 underdog means risking £100 to win £130. The implied probabilities are 60% and 43.5% respectively. American odds are designed to make the vig visible in the gap between the two sides: a -150/+130 line implies a total of 60% + 43.5% = 103.5%, where the extra 3.5% is the book’s margin.
The fluent UK punter glances at any of the three formats and immediately reads the implied probability. The practical drill: convert ten random hockey lines from your book into implied probability, both in the format your book uses and in the format the analytical content uses. Twenty minutes a day for a fortnight will lock it in. After that you stop seeing odds and start seeing probabilities, which is the only useful way to read a moneyline.
Implied probability and vig — finding the fair line
Every moneyline you see at a UK book is priced with vig — the book’s margin built into the spread between the two sides. Removing the vig to get the “fair” no-vig probability is the single most useful piece of maths in betting, and most UK punters never learn it.
Take a sample game. Home team at decimal 1.85 (54.1% implied), road team at decimal 2.05 (48.8% implied). Add the two implied probabilities: 54.1% + 48.8% = 102.9%. The 2.9% overage is the vig. To find the no-vig probabilities, divide each implied probability by the total: 54.1% / 102.9% = 52.6% for the home side, 48.8% / 102.9% = 47.4% for the road side. Those are the book’s fair-probability estimates, before they took their cut.

Why does this matter? Because the no-vig probability is the closest thing to a market consensus on the actual win likelihood. If your own model says the home team should be 55% to win, and the no-vig probability is 52.6%, you have a 2.4 percentage-point edge on the home side at the current price. That’s enough to justify a bet. If your model says 51%, the market has it priced about right and you should pass.
The 3-way moneyline devig is a bit more involved because there are three prices to normalise, but the principle is the same. Sum the implied probabilities of all three outcomes (home regulation, road regulation, tie), then divide each by the total to get no-vig probabilities. The vig on 3-way markets is typically higher than on 2-way markets — often 5% to 8% versus 3% to 5% — which is the cost you pay for the additional outcome.
The single best use of devigging is comparing prices across books. If Book A is showing the home team at decimal 1.90 and Book B at decimal 2.00, devig each price relative to its sister price (the road moneyline at the same book) to find each book’s no-vig estimate of the home win probability. The book offering the lower implied no-vig probability on your preferred side is offering the better price. Across a season of moneyline betting, consistently betting at the book whose no-vig price most favours your opinion adds up to meaningful ROI on top of whatever edge your handicapping produces.
Favourite versus underdog ROI — where the money actually is
Home favourites in the NHL won 64.1% of their games in 2024-25, road favourites won 55.6%. Those are the headline numbers. Translated into implied probabilities, a home favourite needs to be priced at less than -179 (1.56 decimal) to be a losing bet at break-even, while a road favourite needs to be priced at less than -125 (1.80 decimal) to be break-even. Most home favourites are priced shorter than -180 only in the most lopsided talent matchups. Most road favourites are priced shorter than -125 routinely. The break-even thresholds and the actual market prices intersect in revealing ways.
For home favourites, the market has historically been efficient. Blanket betting on home favourites has produced near-break-even results across most large samples, with small ROI either way depending on which sample you pull. The 64.1% headline cover rate is offset by the juice. The market knows what it’s doing on this side.

For road favourites, the picture is more nuanced. The 55.6% win rate is genuinely uncomfortable for a “favourite”. A road favourite priced at -150 needs a 60% true win probability to break even, and the historical hit rate suggests a portion of the road-favourite slate is overpriced because the market overweights talent and underweights venue. Selective road-favourite fading — specifically fading road favourites priced at -160 or shorter who are on the second night of a back-to-back against a rested home dog — has produced positive ROI in multi-season samples. Not blanket fading. Selective fading.
Underdogs in general are where the moneyline market shows genuine looseness. Home dogs at +130 to +180 priced into the market have produced positive blended ROI in recent samples, especially when the home dog has a confirmed elite starter against a fatigued road favourite. The reason is structural: home dogs play harder at home, hold leads better, and benefit from line-change matchups in a way the market doesn’t fully internalise. The handle on home favourites overwhelms the handle on home dogs, and that imbalance leaks into pricing.
The practical rule is to bet the side your model says is underpriced relative to the no-vig probability — but in hockey specifically, the asymmetry of public action means that side is more often the underdog than the favourite. Track your CLV (closing line value) on dogs versus favourites separately. Across a season you’ll see which side your edge actually lives on, and the answer is almost always plus-money.
Parlays versus single moneylines
Accumulators on hockey moneylines are a UK national hobby and a long-term losing strategy. The maths is straightforward and depressing: every leg multiplies the book’s margin. A four-leg acca of -150 favourites pays out at roughly 5.06 to 1, but the no-vig fair price is closer to 5.83 to 1. The book is keeping about 13% of your stake in expected value before you’ve even watched a faceoff.
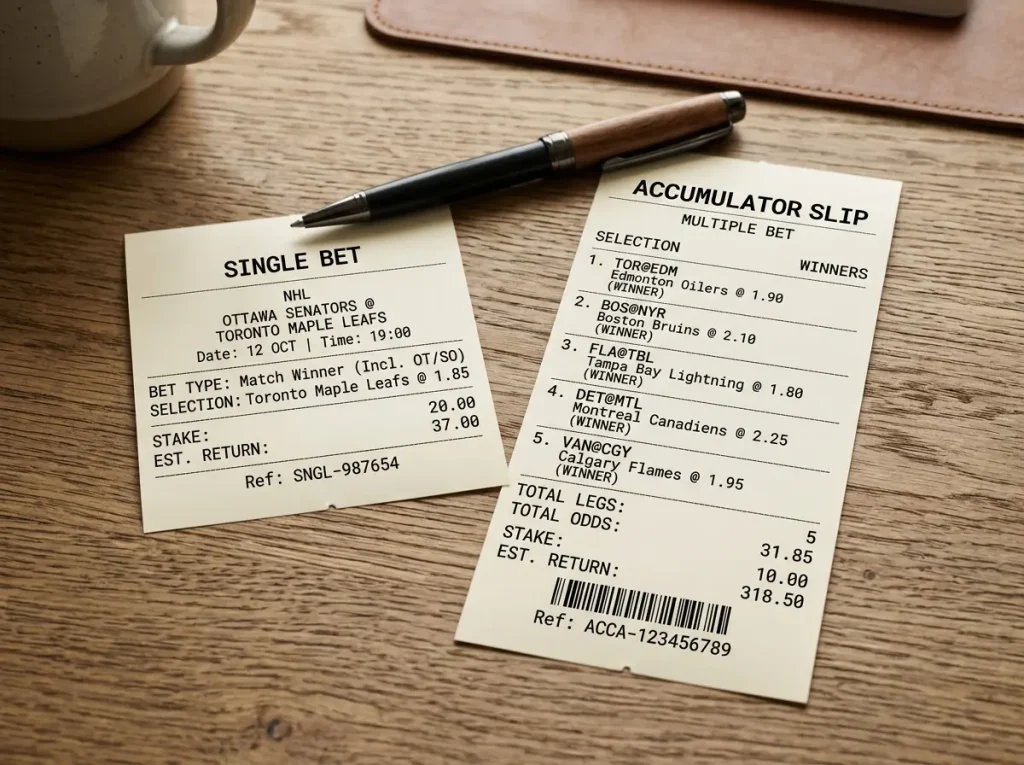
That said, there are spots where accas make sense, and pretending otherwise is dishonest. Same-game parlays on correlated outcomes — for example, home team to win and over the total — can be priced inefficiently because the book’s correlation model is imperfect. If you find a same-game parlay where the correlation is real and the book is pricing the legs as independent, you can extract positive EV. These spots are rare and require pricing each leg’s standalone probability against the parlay payout, which is more work than most punters will do.
Cross-game accas are almost always losing bets in expectation. The promotional offers attached to them — acca insurance, money-back-on-one-leg, boosted odds — partially offset the maths, but the long-run direction is still negative for any combination of more than two legs.
My structural rule on accas: keep them at under 5% of weekly stakes, treat them as recreational, and never use them as the primary expression of a strong opinion. A strong opinion on a single moneyline deserves a single bet. A strong opinion split across four moneylines is a strong opinion diluted by 13% in expected value for the privilege of higher variance.
Situational moneylines — where the calendar talks
The moneyline price you see is built from a base model plus situational adjustments. The book adjusts for fatigue, travel, recent form, injuries. What it doesn’t always price perfectly are the situational moments that are obvious to a punter paying close attention but harder to encode in a model.

The morning-after-an-emotional-loss spot is one. A club that just lost a marquee divisional game in OT — particularly a club with a small leadership group and a head coach known for emotional motivation — tends to come out flat the next night. The market knows fatigue but doesn’t always price emotional carryover. Some seasons that effect is meaningful, others it’s noise. Tracking it specifically across a season will tell you whether it’s playing this year.
Division-rivalry games skew differently. The market generally tightens rivalry lines because the public bets the home favourite hard. Rivalry games also produce more low-scoring outcomes — both clubs play tighter, more defensive systems — which makes the moneyline more straightforward to handicap and the totals more interesting. We have a separate piece on devigging NHL odds to find the fair number that goes deeper into the maths behind these adjustments.
Revenge spots — a team facing a former star player who left in free agency, or a coach facing his old club — are popular media narratives that the betting public consistently overpays for. The data on “revenge games” is genuinely flat, year after year. The market sometimes shifts the line by a cent or two to absorb the public action, which is exactly when the contrarian side becomes the better bet. Karry Shreeve, Head of Hockey at Caesars Sportsbook, made the broader point about player narratives in betting markets succinctly: No player in hockey is worth too much more than 5 percent.
The narratives stories tell about one player carrying a game rarely survive contact with the maths.
Back-to-back situations are the cleanest situational angle and the most reliable. The 2023-24 NHL data showed the rested team in any matchup produced a +13.96 unit profit and 2.2% ROI on the moneyline alone — a genuinely repeatable angle. The home-back-to-back trap, where the home team is on the second night, is worth flagging: home teams on a back-to-back went 58-61 with a -10% ROI in 2023-24, despite the home-ice advantage. Don’t bet home favourites blindly when they’re on the tail end of a back-to-back. The home ice doesn’t outweigh the fatigue. Build a solid foundation for your wagers by following our comprehensive ice hockey betting guide throughout the entire season.
What"s the catch with a +400 moneyline underdog in hockey?
The catch is variance, not edge. A +400 underdog is priced at roughly 20% implied probability. If your model says the dog has a 22% true win probability, you"ve got a 2-point edge — that"s genuinely good. But you"ll lose 78% of those bets. Without a solid bankroll and the discipline to keep stakes flat through long losing runs, the variance will eat you alive even when the edge is real. Big-dog moneylines are a position-sizing problem, not an opportunity problem.
Why do hockey moneylines move more after lineup confirmation than NFL spreads?
Because a hockey lineup is more concentrated in impact than an NFL one. The starting goalie alone is worth 3% to 5% of implied probability, by industry estimates. A scratched top-line forward or top-pairing defenceman can shift the line another point or two. NFL spreads move on quarterback news but absorb most other inactives. Hockey lines move on the goalie confirmation around morning skate, then again on any late scratches — and the moves can be larger than an NFL spread"s response to a comparable injury.
Is a 3-way moneyline (60 minutes) better value than a 2-way ML?
It depends on the matchup. Heavy favourites against clubs that play loose, run-and-gun hockey tend to settle the game in regulation more often, which makes the 3-way regulation line better priced than the 2-way. Heavy favourites in divisional grind-it-out games more often head to overtime, which makes the 2-way moneyline the better choice. Track which clubs play which style — that"s the filter that decides which moneyline to use.
How do I devig a UK fractional moneyline to find no-vig probability?
Convert each fractional price to decimal first: 11/10 is 2.10, 4/5 is 1.80, 6/4 is 2.50. Then take 1 divided by each decimal to get implied probability. Sum the two probabilities — the excess over 100% is the vig. Divide each implied probability by the sum to normalise to 100%. That gives you the no-vig fair probability for each side, which is what you compare against your own model to decide if the price offers edge.
Articles
Published by the Ice Hockey Betting Tips team.
